")
")

Phase contrast imaging is the generic term for all imaging methods that can be used to visualize even small differences in the refractive index within a sample. Such methods are always used when the sample shows hardly any absorption contrast.
As an example of an object that has practically no absorption contrast in visible light we use a hemisphere blown from a transparent plastic foil as used for handicrafts. It could as well have been a flat foil, but I just had that hemisphere. If this hemisphere is placed on a newspaper, the newspaper can be read without any problems (Figure 1). In the closeup view you can see slight distortions of the letters. These distortions indicate that the plastic film is not of the same thickness everywhere or that the plastic does not have the same density everywhere and thus changes the direction of the passing light somewhat by refraction.
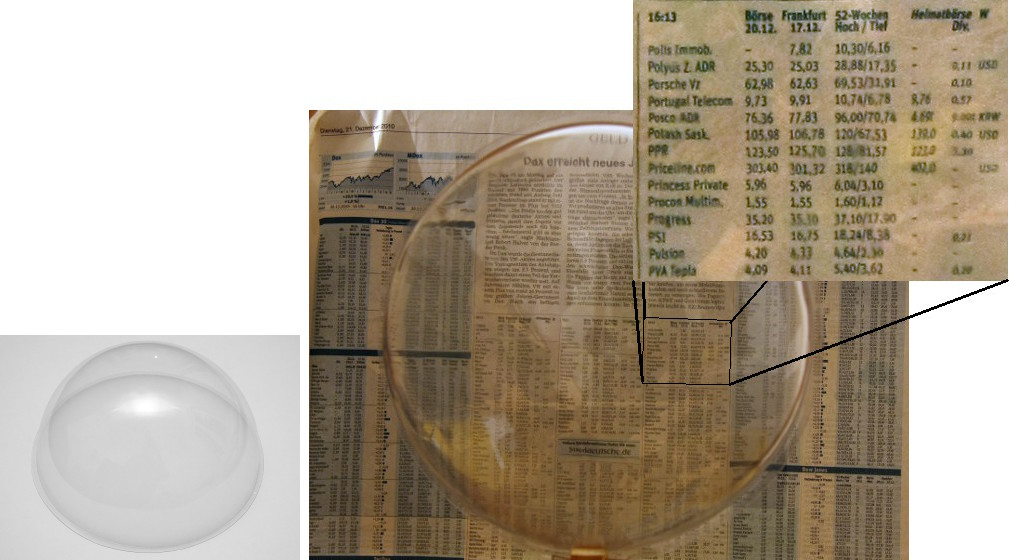
Fig. 1: A newspaper can be read well through a transparent plastic hemisphere.
The differences in film thickness or material density lead to a different phase shift at different locations of the film. If the film is illuminated with a point-shaped light source from a large distance, the brightness distributions shown in Figure 2 are obtained on a white sheet of paper behind the film. The mouse-over shows a sequence of shots in which the distance between the foil and the paper has been steadily increased. The bright spot in the center of the image is caused by reflections on the inside of the hollow spherical film when the film is close to the paper. The small angular deflections that the light experiences when passing through the film cause more light than average to be incident at some points at a relatively large distance from the film, while at other points they lead to the formation of darker shadow areas. Since there is practically no absorption, the light is only redistributed.
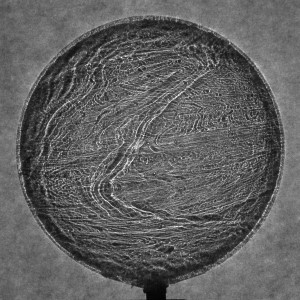
Fig. 2: Brightness distribution behind the transparent plastic hemisphere illuminated with a point light source. 
The effects described in this example can also be used for phase contrast imaging with X-rays. This allows the investigation of opaque samples in the visible wavelength range without absorption contrast. Examples would be breast tissue for the investigation of cancer tissue, the orientation of fibers or cracking in fiber-reinforced composite materials such as the wings of wind turbines or changes to the electrodes of batteries during the charging cycles.
This could be done by simply positioning an X-ray detector very far behind the sample at different distances. However, since the fluctuations in the refractive index and thus the deflection angles for X-rays are extremely small, the distances in the range of many (hundred) meters are impractical.
Phase contrast imaging with Talbot-Lau effect
Figure 3 shows a more practical setup for phase contrast imaging at a punctiform X-ray source Q based on the Talbot-Lau effect. It contains two X-ray gratings, a phase-shifting grating G1 and an absorption grating G2 and a spatially resolving detector D.
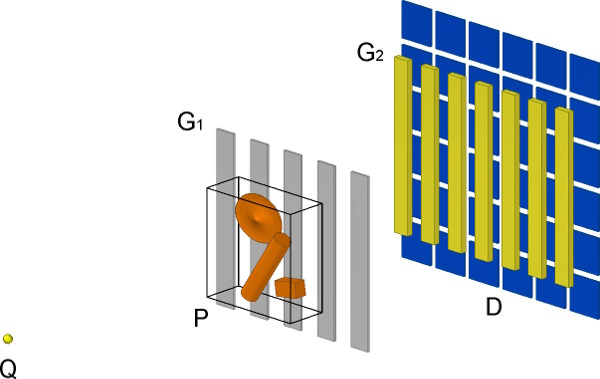
Fig. 3: Arrangement for phase contrast imaging at an X-ray point source Q with the X-ray gratings G1 and G2, sample P and detector D
Function of the components
The incident X-rays are diffracted at the phase grating G1. In Figure 4, nine diffraction orders are drawn as straight lines behind each grating opening. The superposition of the different diffraction orders results in an intensity distribution similar to Figure 4, which is called Talbot carpet. A typical feature of this intensity distribution is that the intensity distribution is repeated at periodic intervals as in the plane of G1. If the second grating G2 is positioned at such a position, it will absorb all light (see mouse-over-image).
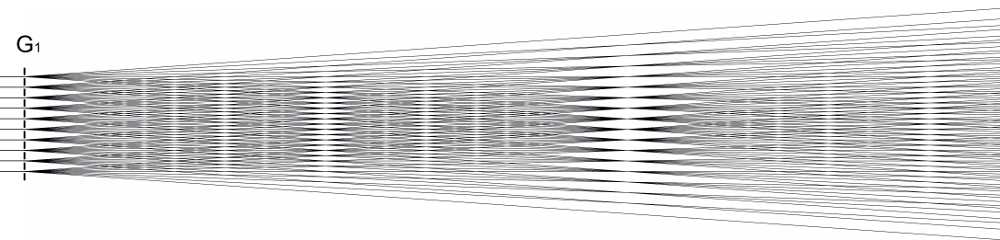
Fig. 4: Superposition of the diffraction orders behind the grating G1
The sample is positioned in front of (or shortly behind) the grid G1. As the sample passes through, the differences in the refractive index of the sample cause the incident wavefront to be slightly deformed. In other words, the light in the sample changes its direction slightly. This changes the directions of the diffraction orders behind the grating G1 and consequently not all beams of grating G2 are stopped. These beams hit the detector behind the grating G2. The grating period of G2 must be very small (in the range of a few micrometers) to achieve a high image resolution. Since the detector pixels (usually in the size of a few tens of micrometers and more) are usually much larger than the grid constant of G2, several images are usually taken between which the grid G2 is shifted perpendicular to the grid lines in small steps. With the help of suitable algorithms, the image of the sample can be reconstructed from these data. A structure as shown in Figure 3 only works if the source is approximately monochromatic and punctiform and thus reasonably coherent. This is the case, for example, with synchrotron sources.
If, for example, an X-ray tube with a rotating anode is to be used as the source, which is commonly used in laboratories, it can no longer be regarded as punctiform with source spot diameters in the range of one millimeter, especially since the source distance is less than one meter. In this case, another lattice G0 is needed that is close to the source. This grid serves to optically divide the source into many narrow strip-shaped sources. These single, narrow sources show a higher spatial coherence and illuminate the sample from different directions. The lattice constants of the lattices must be matched to the distances of the lattices to the source in order for the structure to work.
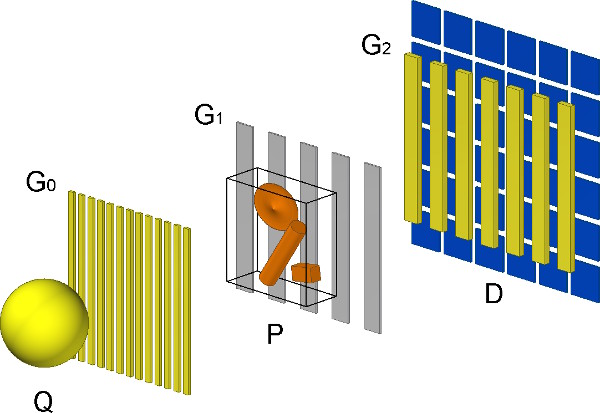
Fig. 5: Arrangement for phase contrast imaging on an X-ray tube with the X-ray gratings G0, G1 and G2, source Q, sample P and detector D
Production of the gratings
The phase-shifting gratings are often manufactured by reactive ion deep etching in silicon wafers, for example at the Paul Scherrer Institute (PSI) in Switzerland. It is crucial to achieve a certain thickness of the grating in the beam direction in order to achieve the desired phase shift.
The required absorption gratings are often produced by deep X-ray lithography and subsequent galvanic deposition of gold, for example at the Karlsruhe Institute of Technology, Institute of Microstructure Technology (KIT/IMT) or by Microworks, see Figure 6. Grating periods of a few micrometers are achieved. For the absorption of the gratings in beam direction (in Fig. 6 from top to bottom) at photon energies of several tens of kiloelectron volts to be sufficient, a gold thickness of over one hundred micrometers must also be achieved (see here, Fig. 5). The large ratio of gold height to grid line width of over one hundred represents a major process challenge.
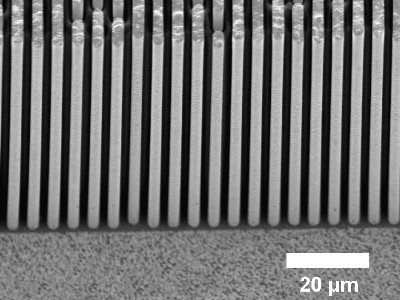
Fig. 6: X-ray absorption grating with gold lamellae on titanium membrane ©01
X-ray phase contrast images
Figure 7 shows different images of an Axolotl:
(a) A photo in visible light. Only the surface of the animal is visible.
(b) A conventional radiography shows the inside of the animal. The differences in X-ray absorption are shown. One particularly recognizes the strongly absorbing bones.
(c) A dark field image, where the same imaging method is used as for phase contrast images, but the evaluation is different. Here, fine, porous, strongly scattering structures such as the surface and the structure of the bones appear particularly clearly.
(d) A phase contrast image shows differences in the tissue very clearly. The air bubble in the upper part of the image (the dead animal had already dried a little) is also sharply outlined.
The images (c) and (d) were taken with a tiled X-ray grid composed of several smaller grids. Since the production of large grids is difficult due to the process, the KIT/IMT has developed a method for tiling such grids with a maximum grid area of 200 mm x 200 mm (as of 2017). Microworks produces a maximum grating area of 400 mm x 100 mm, which is sufficient to reproduce a human thorax (as of 2019).
 Image comes later
Fig. 7: Phase contrast image of an axolotl using tiled grids: (a) photo of the object with scale, (b) absorption contrast, (c) dark field image, (d) phase contrast ©01 [Schr 2017]
| [Schr 2017] | T. J. Schröter, F. Koch, D. Kunka, P. Meyer, S. Tietze, S. Engelhardt, M. Zuber, T. Baumbach, K. Willer, L. Birnbacher, F. Prade, F. Pfeiffer, K.-M. Reichert, A. Hofmann, and J. Mohr, “Large-area full field X-ray differential phase-contrast imaging using 2D tiled gratings,” J. Phys. D. Appl. Phys., 2017 |